


- Construction Prices: National Non‐Residential prices remained flat through Q2 of 2021
- Forecast: Inflation, moving forward, is projected to be 0.5% per month, assuming a re-opening of the economy post-pandemic and continued monetary and fiscal support
- Fed Watch: The Federal Reserve continued monetary stimulus in line with the “new normal”
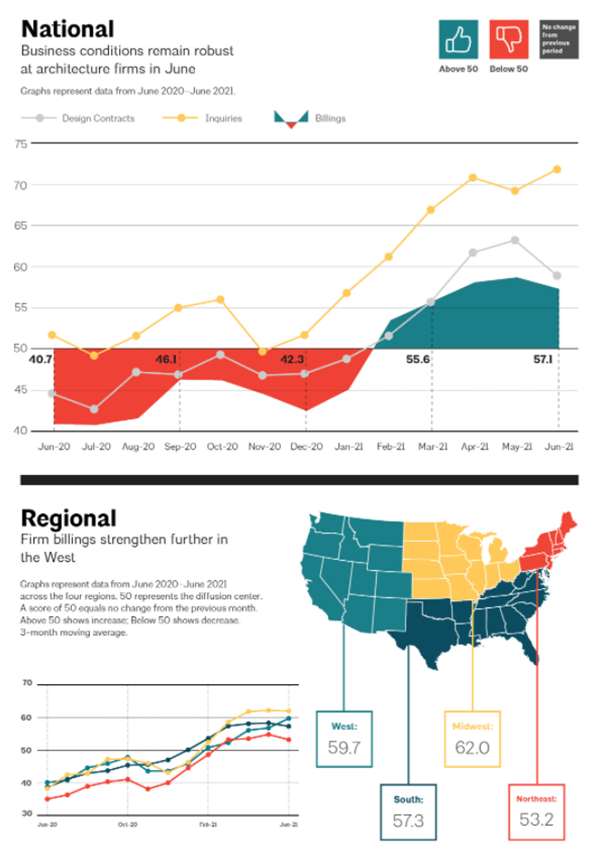
- Architectural Billings: Q2 has continued growth in both inquiries and billings; the increase in the second quarter billings is close to a record high of 58.5 in May. Billings are showing growth in all regions
- Construction Dollar Volume: Residential construction continues to boom reaching new highs in Q2; non-residential construction is down year over year 4.5%, while infrastructure spending is also down by 5.4% year over year
- Contractor Backlog: Northeast backlogs have declined this month but remain higher than pre-pandemic levels. The remainder of the country remains below pre-pandemic levels.
- Commodities: COVID-19 projections, a declining USD, and rapid residential construction growth have created short term price spikes; steel continues to climb in particular for non-standard shapes
- Construction Job Growth: Approximately 38,000 construction jobs were lost in Q2, or -0.5%; construction employment is still down 3.1% since pre-pandemic. June's growth has tapered off parallel with the resurgence of the pandemic.
- Growth in Employment: Monthly average job growth through Q2 was 0.57M as the economic recovery begins to accelerate. The resurgence of the pandemic and concerns for back to school will affect back to work plans for parents
- New York Stock Exchange: The stock market grew by 5.6% in Q2, and has completely recovered reaching new highs in Q2; overall the NYSE is up 81% from the March 2020 downward spike
- Gross Domestic Product: Initial GDP projections point to an annualized growth rate of 9% for Q2 2021
- Personal Consumption Expenditures (PCE): PCE, the key consumer inflation indicator for the Federal Reserve, is up 4% year over year (June 21/ June 20)
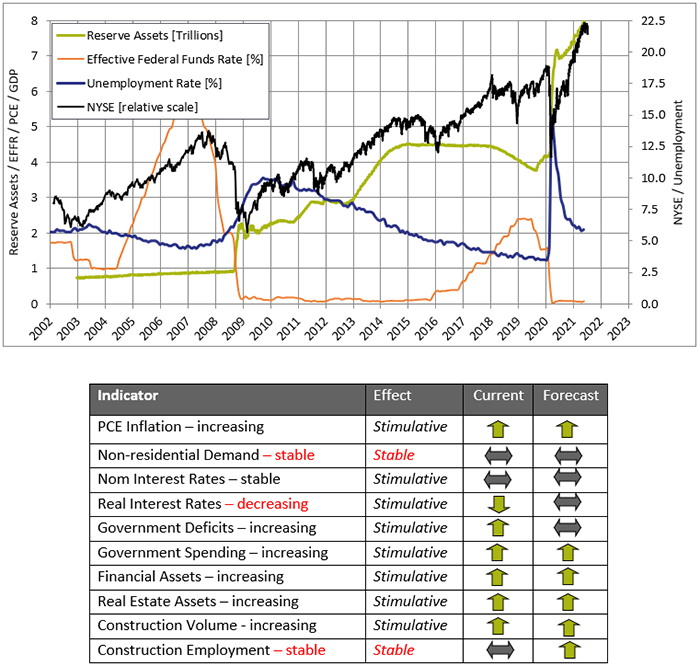
Fed Watch
Inflation and employment targets propel monetary policy, and subsequently construction prices. The “new normal” of pushing inflation above 2% and high labor force participation will likely mean continued 0 to 0.25% percent interest rates and continued asset purchases for a 3 to 5-year time horizon. Continuing low interest rates are good for stability in the interest-rate-sensitive construction sector. Federal Reserve
Also, visit our Market Outlook Construction slides for more info on this topic.
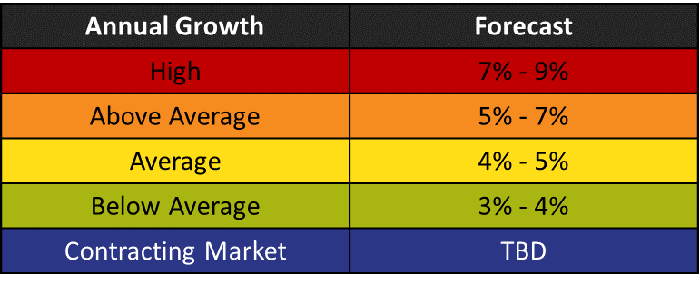
Vermeulens Construction Cost Index
As contractors continue to rebuild their backlogs and workflow, price projections have shifted to escalation for the medium term.
Prices for Q2 2021 nationally remained stable with some increases in busy local markets.
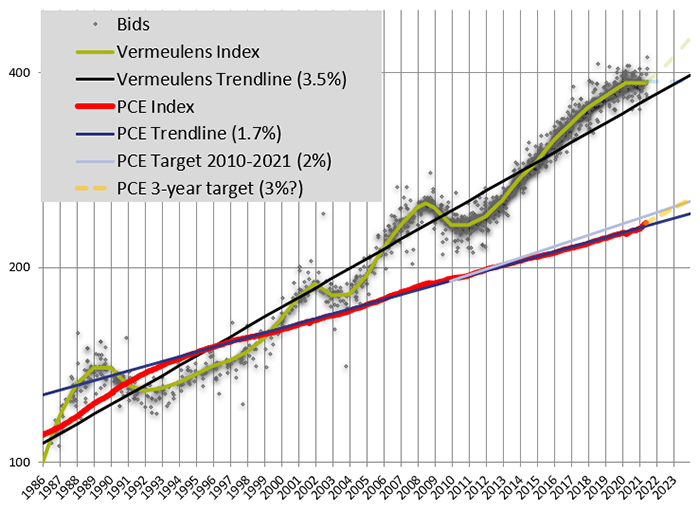
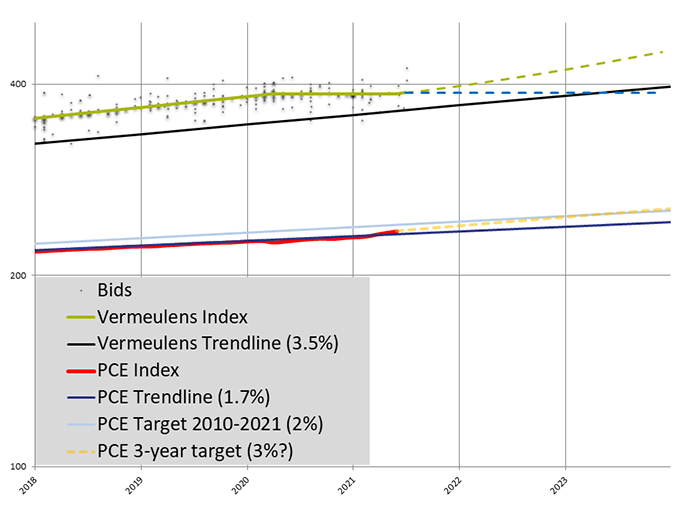
For the past 34 years, construction prices have trended at a 3.5% annually compounded escalation rate. The rate of escalation seen in construction costs relates to the target of 2% annual inflation for consumer prices and the monetary policy used to achieve this goal. Personal Consumption Expenditure inflation for Q2 was 4%.
Following the global recession construction bid prices for institutional projects fell by 14% from their peak in 2008. During 2011, Vermeulens saw an average selling price increase of 3%. This was followed by a 6% increase in 2012, 8% in 2013, 6% in 2014, 8% in 2015, 6% in 2016, 5% in 2017, and 4% through all of 2018 and 2019. The effects of COVID-19 flattened price levels starting in April 2020.
The chart below illustrates bid prices for non-residential construction projects relative to the Construction Trendline (1986 = 100) of 3.5% and the 1.7% Personal Consumption Expenditures Index Trendline.
AIA Billings
Architectural billings are a leading indicator for future construction volume. A score greater than 50 indicates growth. Design fee billings typically indicate construction volume 9 -12 months in advance.
Architectural Billings inquiries and contracts have been steadily rising, led by the Midwest, since Q4 2020, becoming workflow in Q2 2021. AIA Resource
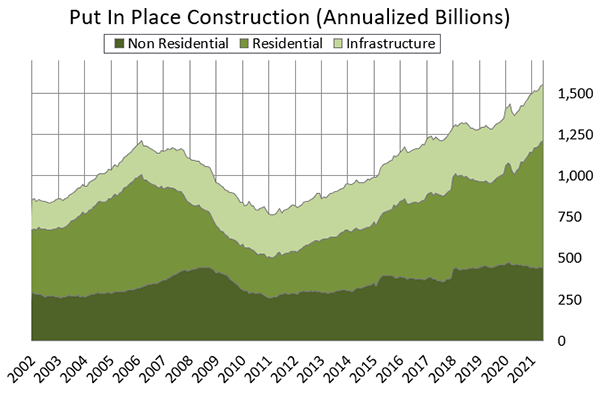
Put In Place Construction
Construction dollar volume grew in Q2, recovering 2.6% since March 2021 and 12.2% year over year increase (June 20/June 21). Construction dollar volume is the main driver of construction prices.
Residential dollar volume had a strong Q2, improving year over year by 37.3% (June 20/June 21).
Non-Residential spending is down 4.6% year over year (June 20/June 21). Reduced margins in Non-Residential construction volume has flattened escalation in this sector.
Infrastructure spending decreased in year over year spending by 5.4% (June 20/June 21).
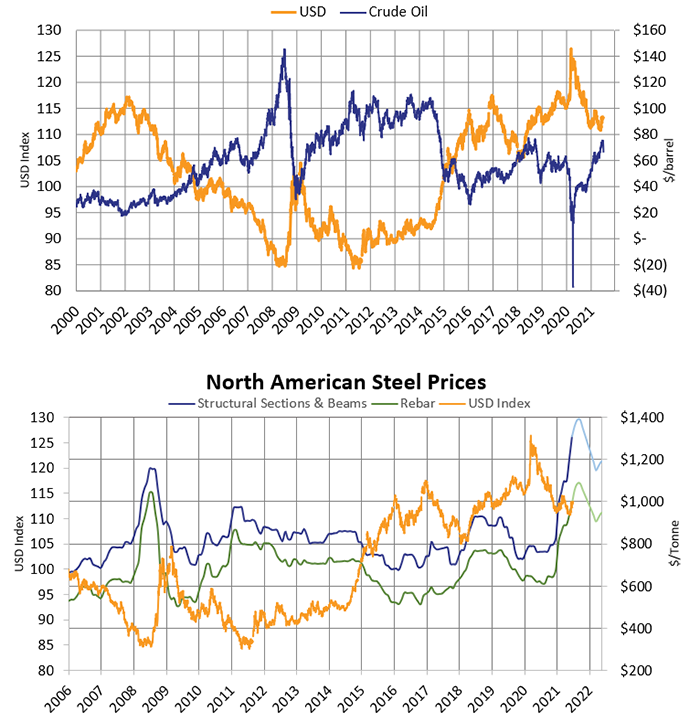
Commodity Prices
Crude Oil reached $73.52 per barrel at the end of June 2021. Prices increased throughout the quarter, peaking at $74.21 on June 25th.
Structural Steel prices through Q2 increased from Q1 2021 levels. Structural sections and beams increased by 19.74% and rebar is up by 11.96% since March 2021. Steel futures indicate a gradual return in prices by 2022.
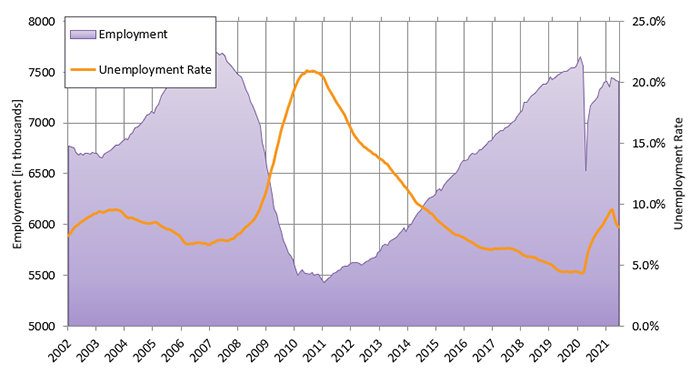
Construction Labor Market
Construction Unemployment at the end of Q2 sits at 7.5%, down from 8.6% at the end of Q1.
Construction Job Growth was -38,000 or -0.5%, this quarter. As labor supply tightens, wage and profit increases in the sector will draw new entrants, restructuring from other sectors of the economy.
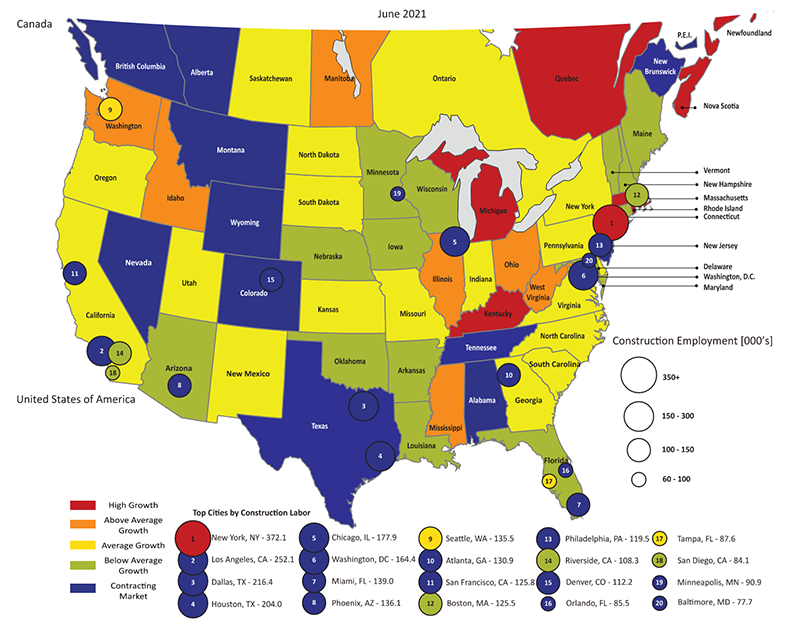
Construction Labor Force Growth Rate
Construction Labor Force Growth Rate compares June 2021 to June 2020.
Total Jobs and Market Performance
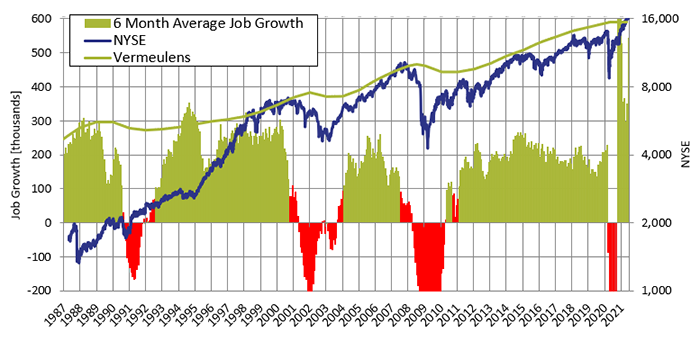
Total Job Growth in the US economy during Q2 2021 saw an average monthly increase of 567,000 jobs, as jobs returned through continued economic recovery efforts. Job growth increased during Q2, ending with 850,000 jobs added in June. Sudden change due to pandemic response contrasts with financial recessions of the past 35 years.
The chart below removes short-term fluctuations in job growth by looking at a 6-month moving average. The size of the labor force grows at 100,000 per month due to population increase. Sustained periods of recession, where job creation remains below 100,000 jobs per month, has accompanied dips in construction prices as illustrated by the red bars below.
Employment Percentage of Total Workforce
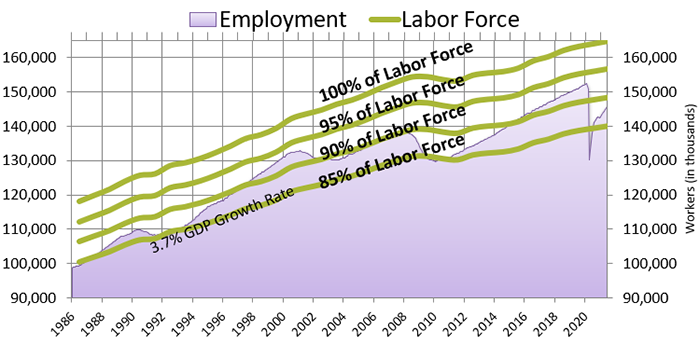
Total employment as a percentage of the total workforce continued its gradual recovery reaching 89% at the end of Q2 2021.
The chart below shows total employment as a percentage of the US workforce. The Federal Reserve will accommodate growth toward full employment. The Fed has no set target for employment, though recent history suggests an expansion of 10 million should be expected.
Forecast - National Trend
Construction prices for the non-residential sector remained flat in Q2 2021. As backlogs in this sector rebuild, currently at 8.5 months, sellers will restore margins and cover supply chain risks. Assuming a continued opening of the economy we recommend ½% per month escalation for the second half of 2021. Local markets with excess demand may require an additional bidding contingency and scope alternates. We recommend up to 5% bidding contingency and up to 10% scope alternates to provide flexibility in these circumstances.
The Federal Reserve’s “new normal” will raise inflation indexes above the recent trend of 1.7%. Short-term inflation is targeted to exceed 2.5% for a 3 to 5 year period in order to re-establish the 2% long-term target.
Vermeulens strives to give our clients the greatest possible value and results for their projects.
If you need any help with your projects, want to set up a presentation to your group, would like to meet to see how we can help your team, or are looking for company information,
Please contact: Marisol Serrao, Director of Marketing
https://data.bls.gov/timeseries/CES0000000001
Richard Vermeulen
Senior Principal
Richard has been in the industry for over 3 decades. He is the creator of the Quarterly Market Outlook and chairs the Vermeulens Forum.