The Feds New Normal

Recent Blogs
- Market Outlook Fed Watch Part 2
- Market Outlook Fed Watch
- Steel Industry Volatility, Risks & Risk Mitigation
- Total Benefit - HVAC
- The Ins and Outs of Insulated Concrete Forms
- Mini Construction Market Update
- Where Did All the Wood Go
- How Do You Price an Elephant
- The Pitfalls of Dollar per Square Foot Estimating
- What if This is the Recession?
This information was originally presented at our June 2021 forum and is relevant today with the ongoing increase in interest rates. In this report we explain the history of the Federal Reserve, the new strategy for implementing monetary policy, and compare previous projections for construction costs to current bid prices.
Since its creation in 1913, the Federal Reserve has controlled the money supply mainly through interest rates. Throughout various booms and busts since World War 1, the Federal Reserve has played a role in controlling rates of inflation. With the quick changes caused by the pandemic, the Fed has changed their methodology. This blog provides a look at the history of the Federal Reserve, its response to the pandemic, and its historical relevance.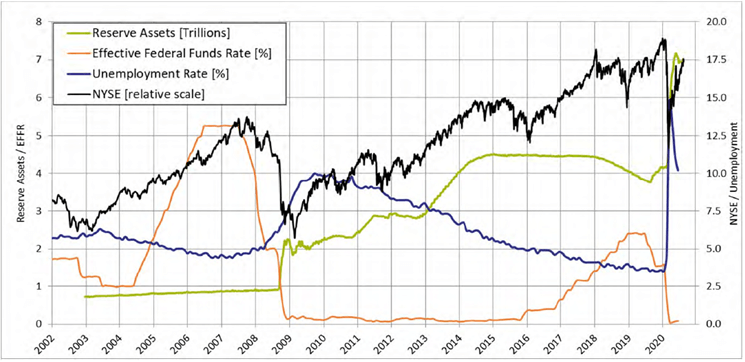
The key driver for price levels in the economy is the money supply. The Federal Reserve controls this supply with interest rates acting on fractional reserve lending, and money creation. In the above graph, the orange line depicts the Federal Funds Rate (interest rates), and the green line indicates Reserve Assets (money creation).
Through 2006 and 2007, with price levels for commodities, stocks, and real estate all accelerating, the construction industry generally forecasted a ramping up of construction price escalation for 2008 and beyond. Our contrasting view at the time, based on previous credit cycles, was that prices would peak and then level off or decline, depending on how well financial authorities could contain the obvious bubbles that existed in housing and commodities.
Now, after a 10-year expansion, we can see an unprecedented response to the pandemic. Major input metrics of the Fed, prices (depicted by the black line for the New York Stock Exchange index) and employment (depicted by the blue line for Unemployment Rate), reacted instantaneously to lockdown and social distancing orders across the globe. Let’s look at some history and gain perspective on where we are and where we should be going.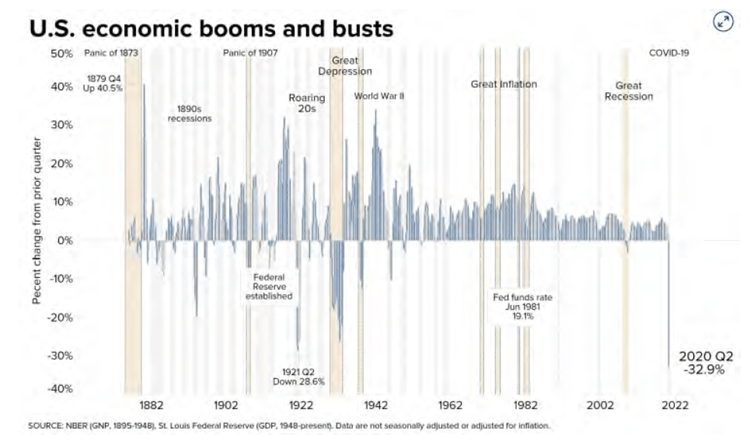
Economic booms and busts have been around for as long as money and credit have, reaching back to the dawn of trading economies. We can see from the chart that a pattern of rapid booms and busts up to the Second World War, has been succeeded by a long period of consistent growth with periodic recessions.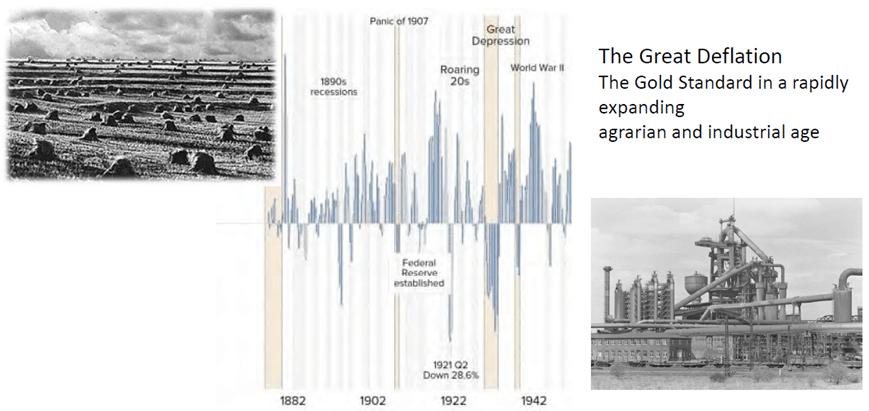
As the industrial revolution took hold in the US, the expansion of both the old agrarian economy and the new industrial economy put enormous pressure on a financial system based on a mostly fixed monetary base, the amount of gold.
Successive credit booms were followed by busts as price levels deflated over time. When credit was scarce, farmers suffered as they depended on borrowing to plant crops. They suffered further when they went to market as deflating prices hit their sales. Meanwhile, industrial enterprises tended to self-finance through retained earnings and rapidly increasing productivity. Farmers were well educated on their reality and a political movement was born to replace gold with the quickly expanding supply of silver.
To counter the boom-and-bust nature of unregulated credit, the federal reserve was created in 1913. Although tied to the gold standard and a long-established orthodoxy, the Federal Reserve was no match for world events such as First World War reparations, the German hyperinflation, the stock market crash, and the Great Depression.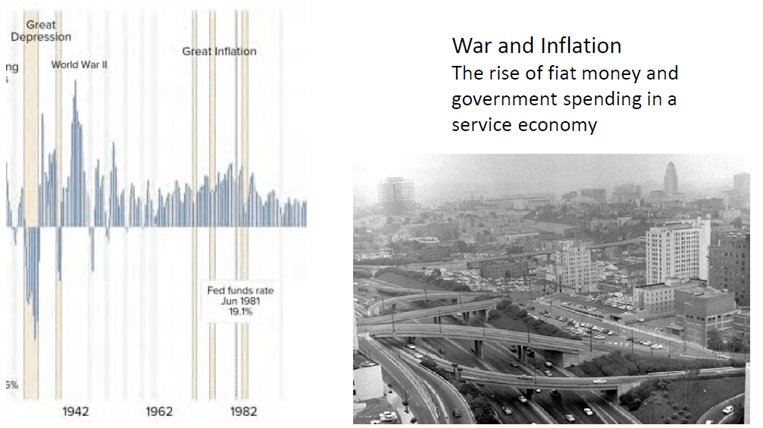
Never was there a harder learned lesson than the ensuing Second World War. Coming out of it were new ways of thinking about trade, financial sector regulation, war reconstruction plans, government spending, and the monetary base. Over time, the guardrails attached to the postwar system started to crumble and the age-old hazard of fiat money started a ratcheting of inflation and inflation expectation.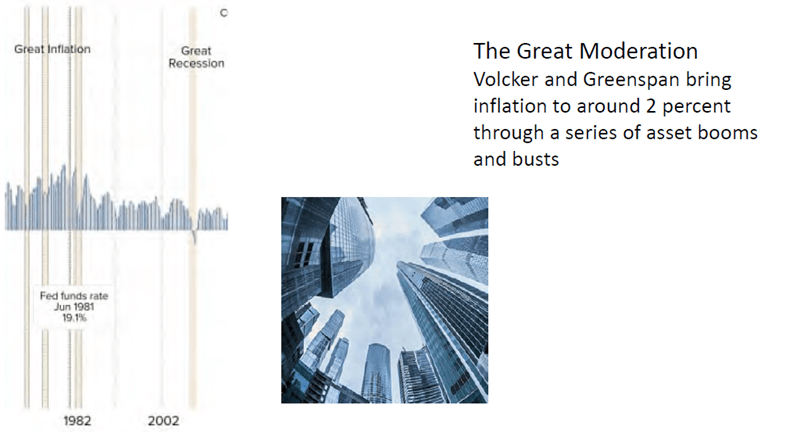
The world turned to the Federal Reserve for answers and new prestige came to the institution as inflation-fighting austerity and relatively free-wheeling asset booms characterized an expansion in production that moderated inflation. However, this success papered over underlying weaknesses that time and deregulation had created.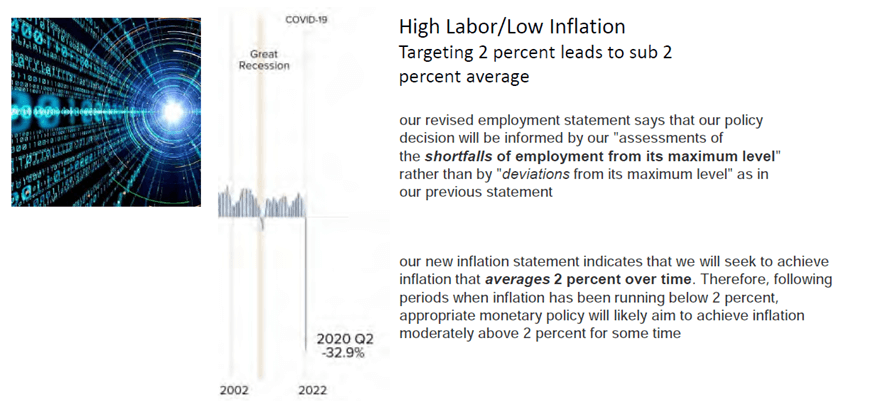
The financial crisis laid bare these weaknesses. Nevertheless, the crisis yielded not only a highly sophisticated set of stress tests and regulatory authority, but a culture of transparency and interagency collaboration that characterizes our current financial discourse.
This “new normal” goes beyond rules and definitions to create an ever-evolving environment of checks and balances. From the quotes above, we can see the willingness of the Fed to both redefine their mission and methodology for both employment and inflation in reaction to a real time course of events.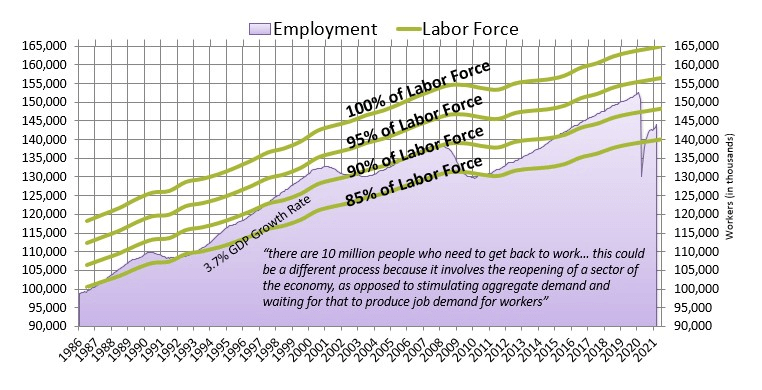
In terms of employment, this means the Fed will continue to provide stimulus because the new normal says that the Fed will act until there is evidence, as opposed to expectation, that employment levels are strong. Previously, if the unemployment rate reduced, the Fed would tighten to ward off a potential rise in inflation.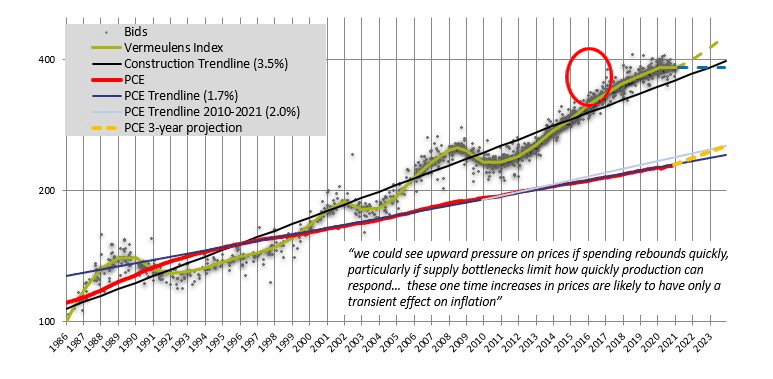
While prices will likely increase, inflation will need to exceed the 2 percent long-term target for some time to move the long-term average up. Therefore, our projections coming out of this pause in price levels is for significant escalation to recoup margins and bring supply growth back to normal and beyond.
Significantly, the Fed will not react to what they consider one time increases in prices. As with the rapid drop in oil prices in the first stages of the pandemic, these price movements adjust for market conditions and smooth out over time.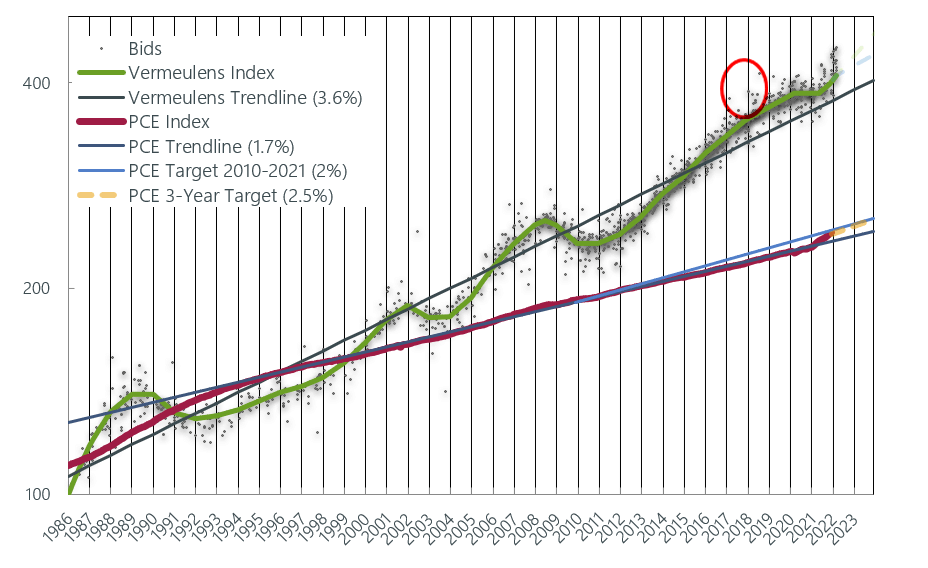
As shown in the June 2021 Vermeulens Construction Cost Index graph, our projections coming out of this pause in price levels were for significant escalation to recoup margins and bring supply growth back to normal and beyond. In comparison, the April 2022 Vermeulens Construction Cost Index shows an increase in construction costs based on bid data as projected for advanced timelines.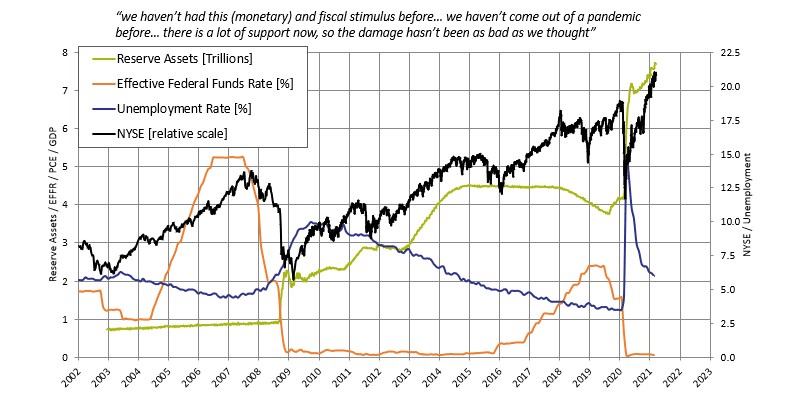
This chart shows the “new normal” very clearly. From 2004 to 2006, we can see the old regime of rising interest rates in the face of asset bubbles, leading to the financial crises. From 2007 to 2008, we can see a steep reduction in interest rates and increased quantitative measures (reserve assets) due to the credit crisis and the stock market crash. From 2011 to 2015, continued quantitative easing caused a stepped rise in investment and asset prices and an expansion in the labor force.
From 2016 to 2019, we see interest rates were raised in expectation that inflation would increase. However, inflation did not rise, and asset rates started to drop. In response, the Fed changed direction with a significant decrease in interest rates. This led to the “new normal” where the Fed will act only with evidence rather than with expectation.
Then with the pandemic, a whole new immediacy to both rate reductions and ongoing quantitative measures, fiscal and monetary, worked in tandem to support price levels in the face of a shock to both employment levels and the fundamental structure of the economy.
In short, Federal Reserve has taken a new approach to managing inflation based on direct evidence of economic changes rather than their expectations. The evidence of increased price levels offsets recent years of below-target inflation. The Fed will use the tools of higher interest rates and quantitative tightening over the next three years to bring inflation to the 2 percent long-term target.

Richard Vermeulen
Senior Principal
Richard has been in the industry for over 3 decades. He is the creator of the Quarterly Market Outlook and chairs the Vermeulens Forum.

Stela Emiri
Estimator
Stela is an Estimator and has been with Vermeulens since 2019. She has a Bachelor of Applied Science in Mechanical Engineering from the University of Toronto.

Jacob Kulpa
Senior Estimator
Jacob has been in the industry for over 5 years. He started with Vermeulens as a co-op student and joined full-time after his college graduation.
Previous Blogs